
Caution E&P Investors - BOE Disclosures May Be Hazardous To Your Wealth
Caution E&P Investors - BOE Disclosures May Be Hazardous To Your Wealth
(Reprinted from a Feb, 2016 article by the author on Seeking Alpha)

BOEs are one of my pet peeves, because the context in which they are often used makes their use misleading. Not all BOEs are created the same, but yet many sources, including media reports, assume they are.
This article, though written in 2016, has many of my thoughts about the usage of BOEs, which is largely unchanged since its publication. Today’s announcement of a merger between $APA, largely a natural gas producer, and $CPE, an oil producer, should illustrate many of these issues, and if nothing else maybe this article will help readers in looking at future deals in 2024.
[This article may truncate due to its length, but I am told that clicking on a button will allow readers to see the full article. Test case for me. Also, please subscribe for further articles that are likely to be published given issues with ‘X’]
Summary
E&P investors will be inundated with news and information about year-end financial results, reserve reports, guidance, CAPEX and other matters in the next few weeks.
One of the most widely used phrases in such releases and discussions or presentations by management is the term BOE, or Barrels of Oil Equivalent.
Despite the relatively innocuous acronym, the term BOE can actually be one of the most dangerous terms investors encounter, having little to do with economic value.
The author examines many ways that the term BOE infiltrates E&P disclosures, from the income statement to the balance sheet to reserves and production data.
The author concludes that using an Economic Value Equivalent (EVE) is much more useful in assessing the results and financial health of E&P companies than is the traditional BOE approach.
Investors might be understandably confused as they sift through upcoming E&P company press releases and listen to management conference calls over the next few weeks, sometimes thinking that they have stumbled by accident into a Turkish bazaar. Trying to entice buyers into parting with their hard-earned cash, company pitchmen try to out-shout each other, struggling to be heard amid the din of the investing throng:
Vendor 1: "Our production volume BOEs are the strongest in the land."
Vendor 2: "Production? Come here instead to see that our LOE per BOE is the best you can find."
Vendor 3: "LOE means nothing, our G&A per BOE is far lower than our competition."
Vendor 4: "G&A? Who cares? Our finding costs per BOE put everybody else to shame."
Vendor 5: "Revenue/BOE? See for yourself; I'm sure we are among the very best."
Vendor 6: "Why argue over such trivial matters when reserves and reserve values are the only thing that matter?"
Almost irrespective of which company you listen to, the phrase "BOE" will usually appear frequently and prominently. Chesapeake Energy (CHK), for example, used "BOE" 34 times in its most recent quarterly news release. What magical powers do BOEs hold for E&P companies and/or their investors?
My answer to that is that the term BOE is nearly useless in the context in which it often appears. I say "nearly" only to try to placate my friends who as engineers or geologists might be prompted to visit me if I said "totally."
Of course, you could listen instead to Lord John Browne, former CEO of British Petroleum (BP), who is reported to have said: "We don't help ourselves as an industry by talking about barrels of oil equivalent. No such thing exists."
BOE stands for "barrel of oil equivalent" and is used to quantify the amount of energy created by burning a barrel of oil. BOE equivalents are used by E&P companies to convert all of their products - oil, natural gas, NGLs, etc. - into a single measure, most often when they report reserves and production volumes.
Natural gas is converted into BOEs based on heating content, which the IRS defines as 5.8 MMBtu/BOE, with 1 MCF of natural gas = 1.03 MBtu. These figures combine to form the 6 mcf/BOE conversion ratio that is a standard within the industry. Exciting stuff, right?
So how can something so precise, so universal in its use and obviously so loved by the investment community be "nearly useless?" The simple answer is that it is measurement that defines a measure of equivalent heating content, not a measurement of a BOE's monetary value.
So what difference does it make? If you were a merchant in the Turkish bazaar accepting payment for your goods, and your pricing was in BOEs, would you rather be paid in oil BOEs or natural gas BOEs? One BOE of oil is worth roughly $30 at today's price while one BOE of natural gas is worth roughly $12. Seems like an easy decision to me, and the answer does not involve natural gas BOEs.
Granted, E&P companies don't operate a bazaar, but $/BOE disclosures ask investors/readers to assume that the products they produce, whether it be oil, natural gas, natural gas liquids/NGLs, other associated products, are somehow the same … just for the sake of simplicity and/or standardization of disclosure. They are not, and investors who assume that they are may be placed unknowingly at higher risk of loss of capital/wealth than they expect.
Historical Prices
The table below show oil and natural gas prices individually by year from 1990 (25 years) and every five years prior to that, dating back to 1960. It also shows the ratio of the price of an oil barrel to a natural gas MCF for each of those periods.
Besides serving as an eye-opener for some to see prices of $2.88/bbl and $0.14/MCF back in 1960, the figures show that the lowest ratio of oil: natural gas approximates its 6:1 heating equivalent in the early 2000s while the ratio has climbed substantially higher over the past 10 years. With the five-year average ratio hovering close to 25:1, the 10-year average is now close to 20:1, coincidentally very close to the averages from 1960 to 1980.
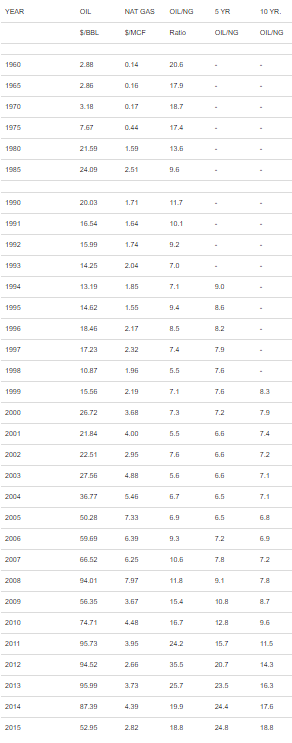
Sources: EIA.gov, author's calculations
So why does the industry continue to use an equivalency that has nothing to do with financial metrics in describing financial concepts? The answer is likely tradition and simplicity, in that the BOE standard has been in place for so long that it is easier to continue with it than to change. Neither the accountants nor the SEC is inclined to intervene either, because the standard is applied uniformly by all E&P companies.
It is interesting to note, however, that the use of the term BOE may be accompanied by a footnote explaining that it is not an economic measure, in company presentations if it appears at all. In fact, Canadian companies all are required to print something equivalent to the following disclaimer in their public materials:
"BOEs may be misleading, particularly if used in isolation. A BOE conversion ratio of 6 Mcf: 1 Bbl is based on an energy equivalency conversion method primarily applicable at the burner tip and does not represent a value equivalency at the wellhead."
So how can readers/investors create something that is meaningful and not misleading from the disclosures that E&P companies make, if those can be misleading?
One alternative approach is to use a different equivalency when computing $/BOE figures and in comparing figures between different companies. The table above suggests that the past 10 years' average of oil prices to natural gas prices approximates 20:1, so let's analyze reported figures using that ratio, in what I would call an "Economic Value Equivalent" (EVE) approach; we'll compare and contrast that to the traditional BOE approach to see what differences it highlights, if any.
Production
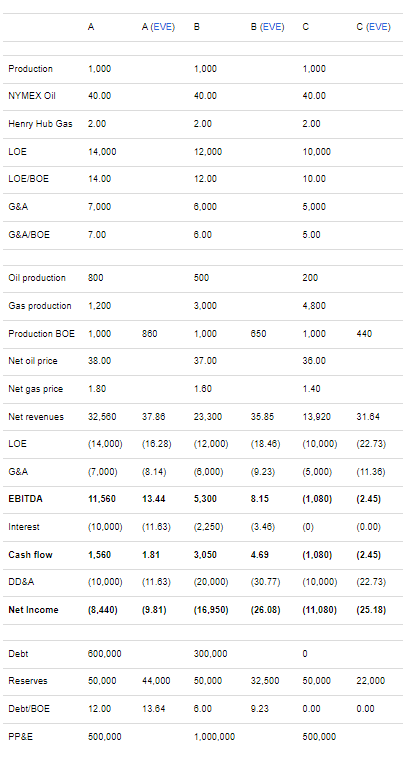
The table below shows production figures for three companies, all of whom produced 1,000 BOE during their most recent quarterly period. Which company would you prefer to own if production were your primary decision point? Maybe they are all equal?
Most people would probably want to know at least how much of a company's production is oil and how much is natural gas/NGLs (which I treat the same here for purposes of simplification since their prices are so closely matched currently). How many times have you seen comments that say, "Well, Company X is a natural gas company, so oil is less important"? Or vice versa?
Often that is because the company discloses production splits by the primary BOE product rather than by revenues. In fact, some companies disclose production based on BOE or MMCFE (million cubic feet of gas equivalent) even when the majority of their production revenues come primarily from the opposite product.
In the table, the first seven rows are line items that are often emphasized in company press releases. In addition to production, companies often cite reference prices for oil and gas, as well as LOE and G&A amounts. Many times they are also accompanied by references to how much per BOE each of those items constitutes, universally designated either with BOE on the traditional 6:1 ratio of oil to gas.
Rows 8-10 represent the breakdown between oil volumes and natural gas/NGL volumes in the production mix. Despite the fact that each company's production might be reported as being equal on a BOE basis to the other two companies, Company 1 had production that was comprised of 80% oil and 20% natural gas, Company 2 had production that was 50% oil and 50% natural gas, and Company 3 had production that was 20% oil and 80% natural gas.
For Company A, production on an EVE basis would have been 860 BOE, Company B would have been 650 BOE on an EVE production basis and Company C would have been 440 BOE. So, treating production on an EVE basis (20:1) rather than the traditional heating value basis (6:1) would have reduced levels in every case (because natural gas reduces production on an EVE basis), including a reduction of 56% in the case of Company C, compared to traditional BOEs. Company C's production on an EVE basis would have fallen to almost 50% of Company A's, nowhere close to the same picture as presented by the traditional BOE approach.
As an aside, one particularly important component is often missing when companies disclose production "growth," a mention of whether that growth was achieved on a per share basis. Growing production for the sake of growth does not necessarily improve shareholder metrics, even though the company itself may have become a bigger producer in the process. If a company merges with another and thereafter reports that production grew by 20%, it matters a great deal if the number of units outstanding grew by 40%, all other things being equal.
Note: Discoveries
Much like production figures, companies like to tout "production numbers" on wells they have recently drilled … although usually they are not production numbers at all. How many times have you read a press release where a statement like the following was made, "The Company recently drilled Well A#1, which achieved rates of 2,000 BOEpd"?
How valuable is that information in terms of predicting the BOEs that the well will deliver? Well, that depends. Was it merely a short-term test rate? A peak rate for some initial period? What was the choke size and pressure? What was the expectation? If the well produces as expected, what will be its actual producing rate 30/90/365 days from now? How much of the production was oil vs. natural gas?
All of those factors are much more important in determining the potential value of those BOEs than is a simple statement with no explanation. This is especially true since it is likely that shareholders will never hear about production from these wells ever again. However, the enticement of reporting some large number to shareholders to show that management is doing its job often is too alluring for them to ignore, even if providing the information should raise more questions for shareholders than it answers.
Pricing and Revenues
Few, if any, companies disclose revenues/BOE, choosing instead to focus on cash flow. Similarly, guidance rarely includes mention of pricing, leaving it up to the reader to supply their own estimates and calculate whatever $/BOE figures they care to on their own. This seems particularly true of companies that have more natural gas production than oil production.
So, is it as easy as just using a standard EVE ratio like 20:1 or 15:1 to estimate revenues from production for a company? After all, oil futures prices on the NYMEX and natural gas futures at Henry Hub are flashed onto TV screens and Internet sites continuously.
Not at all. While one centralized source for pricing sure sounds nice, there are many factors that impact pricing, and thus the value of a BOE, no matter what equivalency factor is used.
Oil pricing. Let's start with how oil is priced … in laymen's terms. The price most readers see is the NYMEX futures price, which is strictly a paper contract for future month deliveries that traders can use to buy/sell/hedge quantities of oil. It is based on the price of oil delivered to Cushing, Oklahoma, where massive storage tanks have been built to "securitize" those futures contracts, more or less.
There are two major types of adjustments that readers need to be able to make to determine a wellhead price for a particular field: (1) costs to transport oil produced in a particular field to Cushing, and (2) the type of oil being produced, in terms of its API gravity, sulfur content, etc. Most companies will disclose the cumulative amount of such adjustments as a "differential" that must be deducted (usually) from NYMEX prices in order to approximate the wellhead price.
The problem with this method is that it is disclosed only quarterly by companies, even though guidance issued will likely disclose what the company expects the adjustment itself to be. But companies do not usually provide guidance on oil prices, so what to do? The best source of information on daily oil postings can be found on the website of certain oil purchasers, which will list their field postings, updated on a daily basis. For example, here is the daily posting bulletin from Plains All American Pipeline (PAA), a major oil purchaser.
Sometimes the cumulative impact of these deductions can be fairly dramatic, and it also varies from time to time. For example, California production usually carries a pretty significant discount to NYMEX, and Bakken production discounts have varied substantially in the past couple of years. Using guidance and then researching pipeline postings regularly can keep readers abreast of net oil price realizations for any company.
Natural Gas Pricing. Like oil pricing, gas pricing that shows up on the screen is a contract futures price, this one based on deliveries to what is called the Henry Hub in Louisiana, where a number of major pipelines intersect. Also similarly, to determine a "netback" price to a particular company's wellhead, transportation costs have to be factored in, and other costs relating to the quality of the natural gas have to be taken into account (for example, gathering and treating costs, etc.).
Natural gas, unlike oil, tends to be priced based on local demand and supplies, as well as infrastructure constraints. Oil can be trucked, shipped by rail and/or pipeline, but natural gas must be transported by an existing pipeline. Pipelines may have been built based on supply/demand expectations a long time ago while current production may have been established in completely different areas (such as the Marcellus). As a result, regional price differences in natural gas prices have developed and must be taken into account.
Again, companies will usually provide estimates in their guidance on an aggregate basis of the differentials its natural gas prices bear to those at Henry Hub. Those prices are based on the prices set at each of the natural gas market hubs that link the major pipelines; a map of these is shown below:
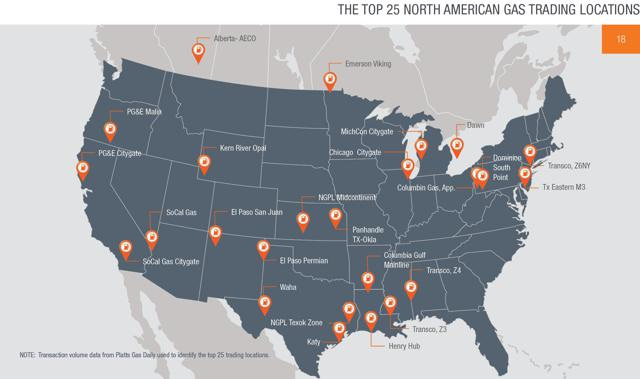
Source: API.org.
Free sites for current natural gas prices are infrequent, but INO.com does have quotes if you are willing to browse through to find the applicable market center hub.
So, while many readers probably think of oil and natural gas prices as being fairly easy to calculate and to monitor, the reality is that there are a lot of floating pieces that must be considered in determining true netback pricing. And because actual sales, at least in the case of natural gas, are done only a month at a time during "bid week," when companies nominate the volumes they intend to sell, to whom and for what price, it can be a volatile process when supplies are plentiful.
So, from equal BOE disclosures come revenue results that vary by over 100% from Company C to Company A. Yet companies disclose production as if there is no distinction between oil and natural gas/NGL production
The Table. Although reference prices are often prominently displayed in company press releases, it is sometimes more difficult to track through to actual realized prices at the wellhead. In the table, rows 2-3 have the same NYMEX prices for oil and the same Henry Hub prices for natural gas. Rows 11-12 are examples of actual wellhead prices derived from taking into account all adjustments for quality, transportation, etc. The spread between the reference price and the actual netback price is referred to as a "differential", and that differential is often disclosed by companies, if not in the press release, then in guidance that is issued by them.
In row 13 of the example, Company A has higher netback pricing than Company B, which in turn has higher netbacks than Company C, all computed on an aggregate basis. The difference between the net revenues generated by Company A ($32,560) and those generated by Company C ($13,920) is striking, considering they both produced the same volumes under the traditional BOE approach. Obviously, this is due to the higher proportion of natural gas in Company C's production mix.
So, from equal BOE disclosures come revenue results that vary by over 100% from Company C to Company A. Yet, companies disclose production as if there is no distinction between oil and natural gas/NGL production.
As a final note on revenues, it is interesting to note that in no case does the production mix pricing equal the reference price. If you view the websites for the oil postings and the natural gas market center prices, you will also note a much wider variation in price than I have assumed. Some areas receive oil prices of $10 less than NYMEX and some natural gas fields receive prices of $1 less than Henry Hub, depending on the time period involved. So, the value of a BOE depends not only on its nature (oil or natural gas), but also on its location as well.
Lease Operating Expenses (LOE)
Companies pride themselves on their LOE/BOE figures as a way to "show" they have lower costs than other companies. Much of the distinction, however, comes from the type of properties owned rather than the fiscal discipline of tightfisted managers. As a general rule, natural gas properties are less expensive to operate than oil properties (at least for wells drilled before the days of shale plays and horizontal drilling) while oil properties are more expensive.
So, if a company reports being a low-cost operator, is it because it operates natural gas properties or other properties that are less intensive (i.e., not secondary or tertiary oil recovery projects)? Do they operate most of their properties, or do they have a substantial number of non-operated wells, whose expenses are actually controlled by other operators?
Have you noticed that LOE/BOE disclosures are much more prevalent than LOE/MCF disclosures? Oftentimes you will see a disclosure that says something like "Our LOE/BOE breakeven point is $40," along with another disclosure that will speak only to oil prices at or above that level. However, as seen above, if a good proportion of the company's production BOE is actually natural gas, the price received per BOE is actually already less than the LOE/BOE figure they quote, even though the "headline" oil price number is not.
In the table, Company A's LOE is $14,000 compared to Company B's $12,000 and Company C's $10,000. On a standard BOE basis, those figures would amount to $14/BOE, $12/BOE and $10/BOE respectively. Clearly Company C does better at managing LOE, right?
Actually, when computed on an EVE BOE basis, which is more closely aligned to value, Company A's LOE is the lowest at $16.28, followed by Company B at $18.46 and Company C dead last at $22.73. Companies will report their LOE on the standard basis, which makes it appear (whether intentional or not) they are more profitable than they are; after all, Company C might proclaim, if our LOE is $10/BOE and oil is at $30/bbl. we are a low-cost operator. In truth, it is the fact that their production is primarily natural gas that makes them appear to be low cost, and their revenues/BOE give them up as not being very low cost at all.
General and Administrative (G&A)
G&A/BOE is one of my favorite disclosures. For those of you who haven't read my earlier memo, E&P Stocks and G&A: In Search Of The Hydra, I would advise doing so. All G&A expenses are allocated between many different activities and appear in many different places in the financial statements, including LOE, G&A, marketing, and exploration in the income statements, as well as non-cash compensation in the cash from operations statement and in several categories of CAPEX from Exploration through Drilling through Acquisitions.
So, the real question for companies is, "Which measure of G&A do you use in calculating G&A/BOE?" If a company capitalizes 50% of its G&A like Chesapeake does, does its G&A/BOE really compare to other companies who capitalize a lesser percentage? The amount of G&A capitalized is disclosed in footnotes to the financials in the 10-K.
Also, because G&A can be allocated to LOE, is it a fair comparison to take one company that allocates a lot of its G&A to LOE to one that classifies those expenses as G&A? Or is the better comparison to combine LOE and G&A when making comparisons to avoid that potential? I would suggest the latter method, but that is mostly because I know how arbitrary these internal allocations can be.
Row 15 in the table shows that Company A has G&A of $7,000, Company B $6,000 and Company C $5,000. As with LOE, G&A figures can appear distorted when using the traditional BOE approach; they would show $7/BOE, $6/BOE and $5/BOE, respectively. Using the EVE BOE basis, those same numbers would be $8.14/BOE, $9.23/BOE and $11.36/BOE, respectively, the inverse of the relationship in traditional BOE disclosures.
EBITDA
Analysis of E&P companies has shifted greatly in the past year or so. While cash flows may have at one point been considered the most important factor to consider (in a stable to increasing price environment), analysts have now shifted their focus to the balance sheet (to items like debt and liquidity), and to reserve values.
Some companies now do include much more detail on their cash flows per BOE (or EBITDAs for those who prefer to use that term). Despite all the verbiage above that helps distinguish metrics/BOE on a line item basis in the revenue statement, another way to account for variation in a company's product mix between oil and natural gas/NGLs is simply to calculate cash flow/BOE (or EVE BOE), which will by definition have taken into account all of the factors described above. However, this makes it more difficult to analyze the different components that make up that cash flow/EBITDA.
Row 16 shows EBITDA for each company, with results varying from $11,560 for Company A to $5,300 for Company B to $(1,080) for Company C. Corresponding amounts per BOE would be $11.56 for Company A ($13.44/EVE BOE), $5.30 for Company B ($8.15/EVE BOE) and -$1.08 for Company C (-$2.45/EVE BOE). Clearly, at this point in the analysis, it looks like it's Company A/B/C, in that order, in terms of attractiveness.
Interest
Row 17 computes interest on the assumed debt amount shown in row 21. Company A is assumed to have bonds outstanding at a rate of 8%, Company B has bank debt outstanding at 3% and Company C is debt-free. Once the interest on debt is considered, Company A does not look quite as promising as it did when we looked at EBITDA. Debt will be discussed further below.
Cash Flow
After deducting the interest on debt for all companies, none of them show particularly attractive cash flow figures (Row 18 of the table), although two of the three companies (Company A and B) have positive cash flow and Company C is only slightly negative.
It is at this point that many readers and authors seem to stop their analysis. After all, if a company is cash flow positive, it will survive, right? At least it's breaking even at these levels, right? The next sections will show how dangerous those assumptions are.
The example is intended to be simplistic despite its complexity. It is strictly a snapshot of items in an income statement. It does not make any assumptions about CAPEX and replacement of reserves or of any financing assumptions. Obviously, with little to no cash flow currently, the only way these companies have a chance to replace production is to utilize the capital markets if they are available. That might be the topic for another time.
DD&A
Most readers likely think of Depletion, Depreciation and Amortization (DD&A) as being a fairly straightforward calculation; simply take the cumulative costs incurred and divide by the remaining BOE to determine what the DD&A charge is for a particular period. Listening to managements describe it, it is of little consequence since it is a "non-cash" charge; that is, the production did not require any capital costs during the current period.
In the example: Company A discloses that their DD&A charge is $10,000 ($10/BOE), Company B has DD&A of $20,000 ($20/BOE) and Company C has DD&A of $10,000 ($10/BOE). Whose DD&A is a "better" indication of a company's cost structure and profitability?
Well, row 19 shows that Company A's EVE DD&A is $11.63, Company B's is $30.77 and Company C's is $22.73. Company A clearly does a better job of finding oil and gas if their DD&A is ½ of their nearest competitor, right?
Nothing is what it seems, however. You see, Company A took a huge impairment charge in a prior period that reduced its cost pool and therefore the DD&A/BOE it now reports in its quarterly reports. Adding back that impairment means that its comparable charge would have been $30/BOE, in line with that of Company B. While companies are unlikely to point this out to their current investors, it is important in terms of knowing how a company has performed in the past, because it bears strongly on what are termed "full cycle costs" as a measure of long-term performance.
This technique is less critical when prices are stable and few companies have impairments. However, it will be become VERY important from this point forward, because most companies will have reported impairments by the end of 2016 if not 2015, and this will reduce the DD&A charges for those companies going forward.
Confusing? Sure, but just wait. What about managements' common statement that DD&A is "non-cash" because those capital costs have been incurred in prior periods? Have they really?
Let's say that Company A above acquired reserves four years ago by tapping its bank credit lines. Obviously, the bank supplied cash to the Company to buy those reserves, but if the Company has not actually paid down its credit line with cash flow from those properties, the cash may be gone but the debt lives on in the balance sheet. Many companies are having to acknowledge this in the current environment by noting that their debt must be "managed," which in effect means that the bills are finally coming due in one way or another. Companies who did not use leverage, like Company C, have no such issue even though the impact of price declines impacts them as well.
So, how does a reader handle analysis of cash flow? Using a DD&A rate to approximate the company's cost of replacing production is certainly one way; if the company does not have access to capital those costs have to be accounted for out of available cash flow. If companies do not generate cash flow sufficient to replace reserves through cash flow, that is a telling result when the capital markets are closed off, as they are today to many companies.
Taking Company A from the example, taking DD&A of $10/BOE ($11.63 EVE BOE), or $10,000, gives the amount necessary to replace what has been produced. Readers may often take this into account in assessing the likelihood that production can be replaced, but often do not consider repayment of debt, viewing that as something the capital markets (i.e., debt or equity offerings) will take care of. Accounting for debt repayment is discussed below, as it is a separate consideration from income statement/cash from operations analysis.
Other BOE Disclosures
There are many other places that BOE disclosures occur, but I will briefly address a few that arise in connection with the capital structure and reserves.
Debt
What, you say? You've never seen a company disclose its debt per BOE? Why do you think that is? Could it be that with all the statistics a company may use to develop a positive story, the use of debt per BOE highlights something they would rather not highlight … unless its debt level is very low?
Debt per BOE is actually a very useful calculation, one that helps analyze different companies using a standard measure. Obviously, the nature of a company's reserves (oil vs. natural gas/NGLs) also impacts how good the measure looks. If a company with natural gas reserves has debt per BOE than is higher than wellhead prices per BOE, wouldn't that be a critical factor to know? The same goes for oil, of course.
Many articles on SA and comments focus on terms like "breakeven cash flow" or "distributable cash flow." However, these articles do not focus on the impact that allowing for repayment of debt has on a company's ability to extend or refinance its debt.
In fact, breaking even on cash flow in the context of an overleveraged company is simply a way of stating that the company will likely go bankrupt slower than another company. Even if a company is not reserving or otherwise setting aside cash to repay debt, it needs to be able to show that it can repay its debt out of cash flow in order to attract capital.
What does a lender assume? Actually, there are two very time-tested "rules" that are applied to E&P companies: (1) an asset-based test that in normal times allows a company to borrow somewhere between 50% and 60% of its then-current asset value; and (2) a cash flow-based test that says that a loan should be capable of paying off a company's debt within the economic half-life of the reserves (typically 4-5 years).
Never heard of these tests? Haven't seen them referenced in any press release or in any description of loan covenants, etc.? Well, that is because they are lender standards that are used at the incurrence of debt to assess the creditworthiness of the borrower and, in the case of bank credits, in determining the borrowing base that will be the maximum amount a bank will lend its borrower. They are not set in stone, they are not publicly disclosed and, like the borrowing base itself, they can be changed at the discretion of the bank.
What does this mean for our example? Well, it means that Company A has to be able to show it can retire its $600,000 in debt within four years, let's say. Whether it actually sets aside funds to do so or not, it must be prepared to pay $150,000/yr. to assure that its borrowing base remains intact or, in the case of other debt, that it will still be able to refinance the debt when it comes due. Company A, with cash flow of $1,560 for the quarter, will likely never be able to repay its debt, and if the bank requires principal payments, it's only effective recourse may be to seek Chapter 11 protection.
Company B is not in a much different position, with its $300,000 in debt and only $3,050 in cash flow per quarter. Company C, even though it is currently cash flow negative, is actually in the best shape of all the companies since it has no debt to repay, although negative cash flow is not a sign of particular health either.
Likewise, the bond market typically limits total debt to 50-65% of the value of the company's assets at the time of the loan, preferably less. Any scenario that does not provide those cushions/ratios will not be financed/refinanced, at least with debt. Breakeven cash flow, by not generating enough cash flow to ensure repayment of debt, almost surely guarantees a head-on collision between debt holders and equity. Equity does not fare well in such situations.
One way to take this into account is for readers to construct their own "cash flow" statements that take debt into account. If a company has $8/BOE in debt, then the company needs to be able to generate $16/BOE in cash flow just for debt repayment (during the half-life of the properties), whether or not they set those funds aside. That way if debt markets close up, as they almost certainly will be for years to come given the massive losses being incurred in this market, they will be able to deal with debt without resorting to discounts or reorganizations of the balance sheet. If nothing else, it will also come closer to putting companies with different debt structures on an equal playing surface.
Finding Costs
Even when accurately calculated, finding costs can be misleading to investors. First, there is the distinction, similar to what was shown in the production section above, between oil, natural gas and natural gas liquid reserves, the distinction between traditional BOEs and EVE BOEs.
The reserve figures that are published in the 10-K and in press releases will give breakouts between the different products, and the values associated with each product are tied to revenues rather than BOEs. Natural gas BOEs have a much reduced value compared to oil BOEs, yet companies report them as if they are the same.
How many times have you read a press release that says something like "We acquired properties containing 1 Mmboe for $15 million for a finding cost of $15/boe?" Well, was it oil or gas? If all the reserves were gas the better disclosure would have been to acquire 6 BCF for $15 million, or $2.50/mcfe. With wellhead prices of $2.50 in 2015 that would mean the properties after expenses would have generated a loss, a much different result than buying at $15/BOE sounds like when oil prices are higher than that. Alternatively, the use of EVE BOE would transform a 100% natural gas, 1 Mmboe figure into 300 mm EVE BOE and give a finding cost of $50/EVE BOE.
Reserves
Like debt, you will rarely find a quantification of reserve values/BOE, even though it is easily calculated from the 10-K disclosures. If the SEC10 value of a company's reserves is $1 bln. and it has 100 Mmboe of reserves, an easy calculation would give a reserve value/BOE of $10 if the reserves were all oil. If readers take the EVE/BOE of reserves based on the actual reserve mix, the numbers will be much higher, more on the order of $30/EVE BOE.
Personally I love the disclosures that say something like the above in disclosing an acquisition, but then do not indicate what percentage of the reserves are currently classified as PUD. PUD reserves require additional capital to develop, so the true overall cost is equal to the initial acquisition cost plus development costs.
In the above example, if 50% of reserves are PUD (as is the case for companies like Ultra Petroleum (UPL) and Memorial Production Partners (MEMP)) which require $15 million in development costs, the "$15/BOE" in finding costs quickly becomes $30/BOE, the true all in finding cost. Calculating EVE BOEs in such a case for 100% natural gas reserves might yield a $100/EVE BOE result, in which case the reserves may not even appear in a reserve report because they would be uneconomic to begin with.
All categories of proved reserves other than proved producing are usually discounted for risk by bankers, lenders and M&A personnel for that reason, with typical discounts of 5-15% for proved non-producing (behind pipe) and 20-30% for PUD reserves. Probable and possible reserves, so-called 2P and 3P reserves, may be given value as well depending on the particular location of those reserves and proximity to other, proved reserves.
Shares
Returning to share counts for a moment, obviously if growth has occurred only because of the issuance of additional shares, the impact to a shareholder can be negative rather than positive. Companies will usually not emphasize when the share counts change, at least prominently enough to generate much notice. Often management is focused strictly on production and reserve growth, as is evident from the way that their incentive plans are often based.
Astute readers will always look to share counts and do comparative analysis per share to see whether production growth or other stats are being reflected in additional growth in equity and/or share price.
Likewise, increasing debt/BOE, however calculated, should be monitored. Debt obviously presents its own risks, even to the likelihood that a company will have to issue more shares at some point in order to pay the debt off if it cannot do so from other sources.
Conclusion
So what is a reader supposed to take from an article that shows a dozen or so ways that BOE disclosures can present investment risk that should be considered when analyzing any company?
1. Realize who the speaker is. Like the vendors at the Turkish bazaar, each company has a story to tell, and that story is designed to keep investors interested in their stock and/or convince them to invest. Companies have thousands of data points to emphasize, so realize you are hearing their "best pitch," not a balanced presentation.
2. Question everything. Any disclosures by a company are designed specifically to tell the story that management wants told. Always ask yourselves, "By telling me X, what does that say about Y?" You know now how many different ways even something as "simple" as BOE can be used, so in what way was BOE NOT used that might tell a different story. That is not to say that managements lie, but rather that they select truths that reinforce their story.
3. Per share calculations. Always be aware of and calculate any BOE (or other) figure on a per share basis. This will highlight things that improve metrics per share instead of growth irrespective of shareholder returns.
4. Use Economic Value Equivalency (EVE), not BOE. If oil and natural gas prices were ever in a heating equivalency ratio, I would not hesitate to tell people to use 6:1, but the pricing table at the start of this article shows that is not an accurate ratio over time. Whether you use an EVE of 15:1 or 20:1 based upon the results of the pricing table or your own belief as to what the "clearing price" should be for both products, the resulting information will be a much more accurate depiction of a company's financial results and health.
5. Evaluate reserve disclosures. Most readers focus on income statements and balance sheets, but E&P companies only own reserves and acreage, which may contain future reserves. There is quite a bit of disclosure that companies have to disclose in their 10-K, and this information can be used to visualize product mixes, finding costs, reasons for changes in reserves, etc., very important in analyzing things like future cash flows, company guidance, and debt repayment. The best way to analyze companies, in my opinion, is to start at the back of the 10-K, in the footnotes to the financials, which is where all the real explanations for what appear in the financials appear.
6. Ignore cash flow projections that do not consider debt. Companies in the E&P business can generate positive cash flow until the day they declare Chapter 11. Far more important is analyzing whether the debt can be repaid under lending standards that have been in place for the past 40 years.
7. Work at it. There are a lot of factors to consider in analyzing an E&P company; there is no easy or simple way to do it, at least not without ignoring risk. If you aren't willing to do the analysis and/or learn more than a few simple sound bites or article headlines reveal, just realize that there are plenty of institutional investors and analysts who actually do this level of analysis and more, and that you may be competing with them for a return of or on your investment. Even if this article presents too many variables to consider, at least incorporate some aspect of EVE into your analysis.
I hope that this article has explained in enough detail how BOE disclosures can be hazardous to your wealth, because you are about to inundated with disclosures from all E&P companies of their year-end financial and reserve information, production and guidance projections for 2016, revised corporate presentations on their websites, and any other manner of disclosures.